Rundeck notification from email

This document describes how to configure Rundeck for email support. Email settings are located in the rundeck-config.properties file. Depending on the installer used, the configuration files will be under a base directory:

vim /opt/rundeck/server/config/rundeck-config.properties

#notification email
grails.mail.host=mail.diegoluisi.eti.br
grails.mail.port=25
grails.mail.default.from=rundeck@diegoluisi.eti.br
grails.mail.username=alertas@diegoluisi.eti.br
grails.mail.password=Passw0rd

Rundeck – Shell Script Backup Sonicwall

How to create a Rundeck Job to Backup Sonicwall over FTP.

#!/bin/bash
# set variables for easy changes
user=admin
password="SW_PASSWORD"
name=$1
host=$2

# load from bash
/usr/bin/expect <”
send “export preferences ftp ftp.diegoluisi.eti.br dluisi \”FTP_PASSWORD\” $name-$(date +%Y-%m-%d).exp\n”
expect -re “.*NSA 3500>”
send “exit\n”
EOF

Captura de Tela 2015-06-11 às 15.24.22

Rundeck add Node Linux

A Node is a resource that is either a physical or virtual instance of a network accessible host. Nodes have a few basic attributes but a Node’s attributes can be extended to include arbitrary named key/value pairs. Attributes typically describe the properties of a node or reflect the state of the node. One of a Node’s built in attributes is called “tags” which is a list of classifications or categories about that Node.

Captura de Tela 2015-06-11 às 14.14.49
1. Create a ssh key and copy to your node

ssh-keygen -t rsa
ssh root@192.168.10.X mkdir -p .ssh
cat .ssh/id_rsa.pub | ssh root@192.168.10.X 'cat >> .ssh/authorized_keys

2. Edit the resources.xml to add new nodes.
vim /opt/rundeck/projects/Project01/etc/resources.xml

3. Add this line:

Captura de Tela 2015-06-11 às 15.04.10

4. Run a command:
Captura de Tela 2015-06-11 às 15.06.19

Success!

How to Install RunDeck

Rundeck is open source software that helps you automate routine operational procedures in data center or cloud environments. Rundeck provides a number of features that will alleviate time-consuming grunt work and make it easy for you to scale up your automation efforts and create self service for others. Teams can collaborate to share how processes are automated while others are given trust to view operational activity or execute tasks.

Rundeck allows you to run tasks on any number of nodes from a web-based or command-line interface. Rundeck also includes other features that make it easy to scale up your automation efforts including: access control, workflow building, scheduling, logging, and integration with external sources for node and option data.

Already itching to install it? Jump ahead to Installing Rundeck.

http://rundeck.org/docs/manual/introduction.html

1. Install Java
yum install java-1.8.0-openjdk java-1.8.0-openjdk-devel -y
java -version

2. Download and configure Rundeck
cd /tmp
wget http://dl.bintray.com/rundeck/rundeck-maven/rundeck-launcher-2.5.1.jar
export RDECK_BASE=/etc/rundeck/
mkdir $RDECK_BASE
mv rundeck-launcher-2.5.1.jar /etc/rundeck/
cd $RDECK_BASE
ln -s /etc/rundeck/server/sbin/rundeckd /etc/init.d/
/etc/init.d/rundeckd start

3. Change your password
vim /etc/rundeck/server/config/realm.properties
admin:Your_Pa$$w0rd,user,admin

4. If after your login you redirect to localhost edit this file
vim /etc/rundeck/etc/framework.properties
framework.server.url = http://yourservername:4440

5. Add Iptables Rules
vim /etc/sysconfig/iptables
-A INPUT -p tcp --dport 4440 -j ACCEPT
/etc/init.d/iptables restart

Zimbra MailBox usage Report

Hello, in today’s article I will demonstrate how to create a script that sends reports of mailbox use by domain, this is very useful for SysAdmin.

mkdir -p /etc/zimbra/scripts/
cd /etc/zimbra/scripts/
vi accountusage.sh

#!/bin/bash
output="/tmp/accountusage"
domain=$1
SendTo="dluisi@diegoluisi.eti.br; admin@diegoluisi.eti.br"
rm -f $output
touch $output
echo "Subject: Mailbox Usages for $domain" > $output
server=`/opt/zimbra/bin/zmhostname`
/opt/zimbra/bin/zmprov gqu $server|grep $domain|awk {'print $1" "$3" "$2'}|sort|while read line
do
usage=`echo $line|cut -f2 -d " "`
quota=`echo $line|cut -f3 -d " "`
user=`echo $line|cut -f1 -d " "`
status=`/opt/zimbra/bin/zmprov ga $user | grep  ^zimbraAccountStatus | cut -f2 -d " "`
echo "$user `expr $usage / 1024 / 1024`Mb `expr $quota / 1024 / 1024`Mb ($status account)" >> $output
done
cat $output | /opt/zimbra/postfix/sbin/sendmail $SendTo -s "Mailbox Usages for domain"

./accountusage.sh "diegoluisi.eti.br"

Expect Script to install the Zabbix-Agent on all Linux Servers

In this article I will demonstrate how to install expect we install the zabbix-agent in all servers at once.

Install expect

# yum install expect expectk

Create dir

# mkdir -p /opt/adm

# cd /opt/adm

Create a list of your hosts to install

# vi hosts.txt

192.168.0.1
192.168.0.2
192.168.0.3

Create the expect Script

If you want to test in 1 host uncomment the line #set host 192.168.0.1 and comment set host [lindex $argv 0]

# vi zabbix_install.expect

#!/usr/bin/expect

set timeout 5
set user “root”
#set host 192.168.0.1
set host [lindex $argv 0]
set pass “Your_Password”
log_file resultado.log

spawn ssh -o UserKnownHostsFile=/dev/null -o StrictHostKeyChecking=no “${user}@${host}”
expect “assword”
send “$pass\r”
expect “${user}@”
send “whoami\r”

#Customizing

send "rpm -ivh http://repo.zabbix.com/zabbix/2.2/rhel/6/x86_64/zabbix-release-2.2-1.el6.noarch.rpm \r"
send "yum install zabbix zabbix-agent -y \r"
send "mv /etc/zabbix/zabbix_agentd.conf /etc/zabbix/zabbix_agentd.conf_original \r"
send "echo Hostname=\$(hostname) > /etc/zabbix/zabbix_agentd.conf\r"
send "echo Server=monitoramento.diegoluisi.eti.br >> /etc/zabbix/zabbix_agentd.conf\r"
send "echo ServerActive=monitoramento.diegoluisi.eti.br >> /etc/zabbix/zabbix_agentd.conf\r"
send "echo EnableRemoteCommands=1 >> /etc/zabbix/zabbix_agentd.conf\r"
send "echo Timeout=30 >> /etc/zabbix/zabbix_agentd.conf\r"
send "echo LogFileSize=0 >> /etc/zabbix/zabbix_agentd.conf\r"
send "echo LogFile=/var/log/zabbix/zabbix_agentd.log >> /etc/zabbix/zabbix_agentd.conf\r"
send "echo PidFile=/var/run/zabbix/zabbix_agentd.pid >> /etc/zabbix/zabbix_agentd.conf\r"
send "echo '############# www.diegoluisi.eti.br #############' >> /etc/zabbix/zabbix_agentd.conf\r"
send "iptables -A INPUT -p tcp -m tcp --dport 10050 -j ACCEPT \r"
send "iptables-save"
send "/etc/init.d/iptables restart"
send "chkconfig zabbix-agent on \r"
send "/etc/init.d/zabbix-agent restart \r"
send "exit\r"
send "exit\r"
interact

Execute in all hosts of your list

for i in $(cat hosts.txt);do ./zabbix_install.expect $i;done

Captura de Tela 2015-05-22 às 13.53.30

Dell Equallogic Storage monitoring using Zabbix with LLD

Dell Equallogic Storage monitoring using Zabbix with LLD

Hello, my name is Diego Luisi and in today’s post I will demonstrate how to monitor DELL Equallogic Storage using Zabbix.

First we download the necessary files to the procedure (scrpt and template)

http://www.4shared.com/rar/_rAmPXMpba/DELL_EQUALOGIC.html

I made some improvements in the standard template, such as applications, graphics, etc.

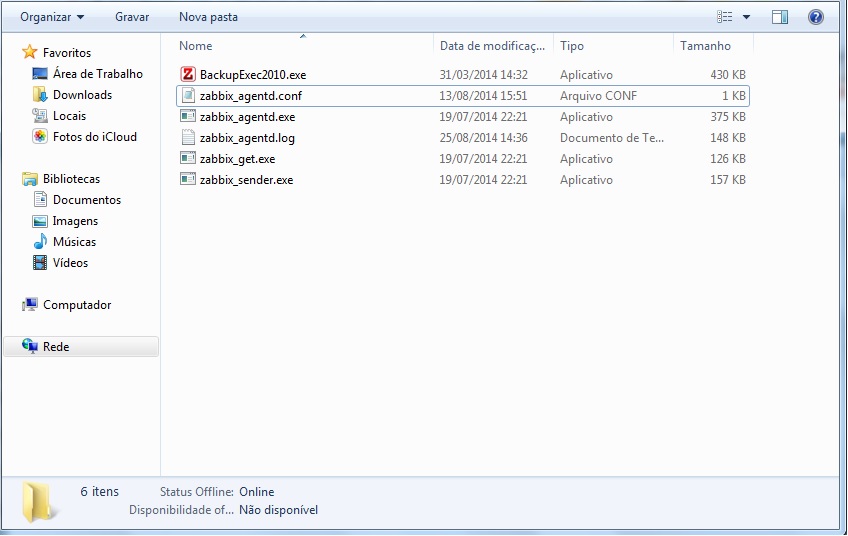
Copy the file to the discover_eqlvolumes.pl externascripts folder of your server zabbix, if you do not know the directory use the following command:

# Cat /etc/zabbix/zabbix_server.conf | grep external.
ExternalScripts = / etc / zabbix / externalscripts

# Cd / etc / zabbix / externalscripts
chmod a + x discover_eqlvolumes.pl
chown-R zabbix: zabbix # / etc / zabbix / externalscripts

Now we create the mapping of values

Value Mapping

Creating Value Mappings
It seems Zabbix does not yet allow anyone to export Value Mappings with a template. The Value Mappings need to be created by hand, for now:

eqlControllerBatteryStatus:

Value Mapped to
1 ok
2 failed
3 good-battery-is-charging
4 low-voltage-status
5 Low-voltage-is-charging
6 missing-battery
eqlDiskStatus:

Value Mapped to
1 online
2 spare
3 failed
4 offline
5 alt-sig
6 too-small
7 history-of-failures
8-unsupported version
9 unhealthy
10 replacement
11 encrypted
12 notApproved
13-preempt failed
eqliscsiVolumeAdminStatus:

Value Mapped to
1 online
2 offline
3 online-lost-cached-blocks
4-control online
5 offline-control
eqlMemberHealthDetailsFanCurrentState:

Value Mapped to
0 unknown
1 Normal
2 warning
3 critical
eqlMemberHealthDetailsPowerSupplyCurrentState:

Value Mapped to
1 on-and-operating
2-in-ac power
3 failed-or-no-data
eqlMemberHealthDetailsTemperatureCurrentState:

Value Mapped to
0 unknown
1 Normal
2 warning
3 critical
eqlMemberHealthStatus:

Value Mapped to
0 Unknown
1 Normal
2 Warning
3 Critical
eqlMemberRaidStatus:

Value Mapped to
1 ok
2 degraded
3 verifying
4 reconstructing
5 failed
6 catastrophicLoss
7 expanding
8 mirroring

Okay, now that we have created the mapping of values ​​we will import the template that we downloaded.

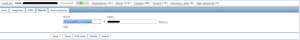
Create a new host (equallogic) and add the template you downloaded earlier.

Add a new macro

{$SNMP_Community}  -> your_comunnity

Macro

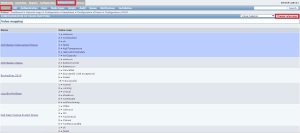
Now is look at the recent data from Zabbix to see the values ​​collected, hope you enjoy.

Reference:

https://www.zabbix.org/wiki/Monitoring_Dell_Equallogic_Systems

Zabbix Monitoring Symantec Backup Exec Server 2010

How to monitoring Symantec Backup Exec Server 2010 with Zabbix

Hello, my name is Diego Luisi and in today’s article I will demonstrate how to monitor Symantec Backup Exec 2010 using Zabbix and auto-discovery.

Firstly download the attached files.

http://www.4shared.com/zip/PWFW6s2Jce/BackupExec2010_EN.html

Unzip the downloaded file contains two files inside an executable and the template.

Copy the executable to the folder where the agent is installed Backup Exec.

Znil BackupExec 2010

Edit the configuration file Zabbix agent (zabbix_agentd.conf) and insert the following line at the end of the file.

UserParameter znil.BackupExec2010 = [*] “C: \ Program Files \ Zabbix \ backupexec2010.exe” $ 1 “$ 2”

Save and exit, then restart the agent.

Add the mapping values ​​in Zabbix, go to administration, general mapping values ​​and add content as image below. 

Value Mapping

Upload the template on zabbix and associate the host to be monitored.


 Reference

http://znil.net/index.php/Zabbix

I translated the template for English and added some triggers and graphs.

How to count number of files with Zabbix

How to count number of files with Zabbix

Olá, meu nome é Diego Luisi e no artigo de hoje demonstrarei como contar a quantidade de arquivos em um diretório usando o Zabbix.

system.run[dir /a-d /s /b “d:\foldername\” | find /c “:”]

Se quisermos contar somente um tipo de arquivo podemos trocar “:”   ->    “*.xml” ou o tipo de arquivo desejado.

Criar um item no host que desejamos monitorar, conforme figura abaixo:

ItemComo podemos ver no “Last Data” a coleta dos valores:

Last Data

Simples né, espero que tenham gostado!

How to monitor MS DFSR Replication Queue with Zabbix

Olá, meu nome é Diego Luisi e no artigo de hoje demonstrarei como monitorar fila de replicação do DFS entre servidores windows usando o Zabbix.

Edite o arquivo zabbix_agentd.conf e insira as seguintes linhas

Timeout=30
UnsafeUserParameters=1
UserParameter=dfs_queue[*], “C:\Zabbix\dfs_queue.bat” $1,$2,$3,$4

Salve, saia e reinicie o serviço do zabbix_agent.

Agora crie um novo arquivo “c:\zabbix\dfs_queue.bat” e insira o seguinte conteúdo:

@echo off


@del C:\zabbix\lista.txt


@dfsrdiag backlog /rgname:%3 /rfname:%4 /sendingmember:%1 /receivingmember:%2 > C:\zabbix\lista.txt


@for /F “delims=” %%a in (‘findstr Membro C:\zabbix\lista.txt’) do set var=%%a


@set var1=%var:~67,75%


@IF “%var1%” EQU “~67,75” (
echo 0
)
@IF “%var1%” GTR “0” (
echo %var1%
)


Agora crie um arquivo chamado “Template_DFSR-QUEUE.xml” e cole o seguinte conteúdo:


<?xml version=”1.0″ encoding=”UTF-8″?>
<zabbix_export>
<version>2.0</version>
<date>2014-05-13T03:34:18Z</date>
<groups>
<group>
<name>Templates</name>
</group>
</groups>
<templates>
<template>
<template>Template_DFSR-QUEUE</template>
<name>Template_DFSR-QUEUE</name>
<groups>
<group>
<name>Templates</name>
</group>
</groups>
<applications>
<application>
<name>DSFR</name>
</application>
</applications>
<items>
<item>
<name>DFS Queue {$RECIVE} x {$SEND}</name>
<type>0</type>
<snmp_community/>
<multiplier>0</multiplier>
<snmp_oid/>
<key>dfs_queue[&quot;{$RECIVE}&quot;,&quot;{$SEND}&quot;,&quot;{$RFNAME}&quot;,&quot;{$RGNAME}&quot;]</key>
<delay>180</delay>
<history>90</history>
<trends>365</trends>
<status>0</status>
<value_type>3</value_type>
<allowed_hosts/>
<units/>
<delta>0</delta>
<snmpv3_contextname/>
<snmpv3_securityname/>
<snmpv3_securitylevel>0</snmpv3_securitylevel>
<snmpv3_authprotocol>0</snmpv3_authprotocol>
<snmpv3_authpassphrase/>
<snmpv3_privprotocol>0</snmpv3_privprotocol>
<snmpv3_privpassphrase/>
<formula>1</formula>
<delay_flex>50/1-7,00:00-24:00</delay_flex>
<params/>
<ipmi_sensor/>
<data_type>0</data_type>
<authtype>0</authtype>
<username/>
<password/>
<publickey/>
<privatekey/>
<port/>
<description/>
<inventory_link>0</inventory_link>
<applications>
<application>
<name>DSFR</name>
</application>
</applications>
<valuemap/>
</item>
<item>
<name>DFS Queue {$SEND} x {$RECIVE}</name>
<type>0</type>
<snmp_community/>
<multiplier>0</multiplier>
<snmp_oid/>
<key>dfs_queue[&quot;{$SEND}&quot;,&quot;{$RECIVE}&quot;,&quot;{$RFNAME}&quot;,&quot;{$RGNAME}&quot;]</key>
<delay>180</delay>
<history>90</history>
<trends>365</trends>
<status>0</status>
<value_type>3</value_type>
<allowed_hosts/>
<units/>
<delta>0</delta>
<snmpv3_contextname/>
<snmpv3_securityname/>
<snmpv3_securitylevel>0</snmpv3_securitylevel>
<snmpv3_authprotocol>0</snmpv3_authprotocol>
<snmpv3_authpassphrase/>
<snmpv3_privprotocol>0</snmpv3_privprotocol>
<snmpv3_privpassphrase/>
<formula>1</formula>
<delay_flex>50/1-7,00:00-24:00</delay_flex>
<params/>
<ipmi_sensor/>
<data_type>0</data_type>
<authtype>0</authtype>
<username/>
<password/>
<publickey/>
<privatekey/>
<port/>
<description/>
<inventory_link>0</inventory_link>
<applications>
<application>
<name>DSFR</name>
</application>
</applications>
<valuemap/>
</item>
</items>
<discovery_rules/>
<macros/>
<templates/>
<screens/>
</template>
</templates>
<triggers>
<trigger>
<expression>{Template_DFSR-QUEUE:dfs_queue[&quot;{$RECIVE}&quot;,&quot;{$SEND}&quot;,&quot;{$RFNAME}&quot;,&quot;{$RGNAME}&quot;].last()}&gt;100</expression>
<name>DFS Fila alta de {$RECIVE} para {$SEND} é {ITEM.LASTVALUE}</name>
<url/>
<status>0</status>
<priority>4</priority>
<description>Fila alta no DFSR</description>
<type>0</type>
<dependencies/>
</trigger>
<trigger>
<expression>{Template_DFSR-QUEUE:dfs_queue[&quot;{$SEND}&quot;,&quot;{$RECIVE}&quot;,&quot;{$RFNAME}&quot;,&quot;{$RGNAME}&quot;].last()}&gt;100</expression>
<name>DFS Fila alta de {$SEND} para {$RECIVE} é {ITEM.LASTVALUE}</name>
<url/>
<status>0</status>
<priority>4</priority>
<description>Fila alta no DFSR</description>
<type>0</type>
<dependencies/>
</trigger>
</triggers>
<graphs>
<graph>
<name>DFS Queue Monitor</name>
<width>900</width>
<height>200</height>
<yaxismin>0.0000</yaxismin>
<yaxismax>100.0000</yaxismax>
<show_work_period>1</show_work_period>
<show_triggers>1</show_triggers>
<type>0</type>
<show_legend>1</show_legend>
<show_3d>0</show_3d>
<percent_left>0.0000</percent_left>
<percent_right>0.0000</percent_right>
<ymin_type_1>0</ymin_type_1>
<ymax_type_1>0</ymax_type_1>
<ymin_item_1>0</ymin_item_1>
<ymax_item_1>0</ymax_item_1>
<graph_items>
<graph_item>
<sortorder>0</sortorder>
<drawtype>0</drawtype>
<color>C80000</color>
<yaxisside>0</yaxisside>
<calc_fnc>2</calc_fnc>
<type>0</type>
<item>
<host>Template_DFSR-QUEUE</host>
<key>dfs_queue[&quot;{$SEND}&quot;,&quot;{$RECIVE}&quot;,&quot;{$RFNAME}&quot;,&quot;{$RGNAME}&quot;]</key>
</item>
</graph_item>
<graph_item>
<sortorder>1</sortorder>
<drawtype>0</drawtype>
<color>00C800</color>
<yaxisside>0</yaxisside>
<calc_fnc>2</calc_fnc>
<type>0</type>
<item>
<host>Template_DFSR-QUEUE</host>
<key>dfs_queue[&quot;{$RECIVE}&quot;,&quot;{$SEND}&quot;,&quot;{$RFNAME}&quot;,&quot;{$RGNAME}&quot;]</key>
</item>
</graph_item>
</graph_items>
</graph>
</graphs>
</zabbix_export>


Importe esse template do zabbix e associe aos servidores que deseja monitorar.

Crie as seguintes macros:

Imagem

DFSR